Short answer: Marketing efficiency ratio (MER) is your total store revenue divided by your total ad spend across every channel. It ignores which ad gets the credit, so it can't be inflated by platforms that each claim the same sale. A "good" MER depends on your margins: divide 1 by your contribution margin to get your break-even MER, and aim above it.
Open Meta, Google and TikTok side by side and add up the revenue each one reports. For a lot of stores, the total comes out higher than what Shopify booked. Every platform is telling the truth from its own point of view, and together they still overcount.
MER skips that argument. It uses two numbers you already trust, your Shopify revenue and your total ad spend, to answer one question: for every euro you put into ads, how much comes back to the store?
This guide covers what MER is, how to calculate it, how it compares to ROAS and POAS, and how to work out what a good MER is for your store.
What Is MER in Marketing?
MER stands for marketing efficiency ratio. You'll also see it called blended ROAS, because it blends every channel into one number.
Where platform ROAS looks at one channel and the conversions that channel claims, MER looks at the whole business. All revenue in, all ad spend out. No attribution model, no click windows, no arguing about which touchpoint deserves the credit.
That makes MER a top-down number. It tells you whether your marketing as a whole is efficient. Which campaign to scale is a question for platform ROAS and POAS.
The Marketing Efficiency Ratio Formula
The formula is:
MER = total revenue ÷ total ad spend
Say your Shopify store did €100,000 in revenue last month, and you spent €25,000 on ads across Meta, Google, TikTok and Pinterest. Your MER is 100,000 ÷ 25,000 = 4.0. Every euro of ad spend went alongside four euros of revenue.
A few choices make your MER consistent from month to month:
- Revenue: use net sales from Shopify (after discounts and returns), and pick whether you include tax and shipping. Either works, as long as you stick with it.
- Ad spend: include every paid channel. Leaving one out makes your MER look better than it is.
- Period: compare like with like. Weekly or monthly MER is more useful than daily, because a single day is noisy.
Some teams also add agency fees and tools to the spend side. That's sometimes called a fully loaded MER. It's stricter, and useful if you want one number for total marketing cost.
MER vs ROAS vs POAS
The three metrics answer different questions. You need all three, at different levels.
- MER = total revenue ÷ total ad spend. It tells you whether all your marketing pays off. Use it at store level, weekly and monthly.
- ROAS = attributed revenue ÷ spend on one channel or campaign. It tells you which campaign drives the most revenue. Use it inside each ad platform.
- POAS = profit ÷ ad spend. It tells you which campaign makes money. Use it at campaign level, especially when margins differ between products.
ROAS is how you steer inside Meta Ads Manager or Google Ads. POAS adds margin to the picture, which we explain in our guide to POAS and new vs returning customers in TikTok. MER sits above both and checks whether the sum of all those decisions works for the business.
Why Platform ROAS Overcounts and MER Doesn't
Every ad platform attributes sales using its own rules. A shopper sees a TikTok video, clicks a Meta ad two days later and finally buys through a Google search. TikTok, Meta and Google can each count that one order as theirs.

In this example (example numbers), the platforms report €116,000 in revenue between them, while the store booked €100,000. If you add up platform ROAS you'd think your marketing returns 4.6. MER says 4.0, because it counts every order exactly once.
There's a second problem that pulls the other way. Browser pixels miss around 30-60% of conversions because of ad blockers, iOS privacy and consent banners. So a platform can also underreport its own sales. Double counting on one side, missing data on the other, and you can't tell which effect is bigger by looking at the dashboards.
MER is immune to both, because it only uses two numbers you know for sure: what came into the store and what you spent.
What Is a Good Marketing Efficiency Ratio?
There's no universal good MER. A MER of 3 is great for a store with fat margins and a loss for one that sells on thin ones. The number that matters is your break-even MER.
Break-even MER = 1 ÷ contribution margin
Your contribution margin here is what's left of each euro of revenue after product costs, shipping, payment fees and other variable costs, but before ad spend. If 40% of revenue is left, your break-even MER is 1 ÷ 0.40 = 2.5. At a MER of 2.5 your ads exactly eat up that margin. Above it, marketing adds profit. Below it, you lose money on every order your ads bring in.

- 30% contribution margin: break-even MER of 3.3
- 40% contribution margin: break-even MER of 2.5
- 50% contribution margin: break-even MER of 2.0
- 60% contribution margin: break-even MER of 1.7
- 70% contribution margin: break-even MER of 1.4
Your target MER sits above break-even, by as much as the profit you need to cover fixed costs like salaries, software and rent. A store that wants growth may accept a MER close to break-even for a while, because some of the new customers it buys will order again. A store focused on cash flow will want a wider gap.
That's why you shouldn't copy a "good MER" from another brand. Work out your own break-even, then decide how far above it you want to be.
Acquisition MER: The Number Behind Growth
Plain MER has one blind spot: it includes revenue from returning customers, many of whom would have bought anyway. A store with a big, loyal customer base can show a healthy MER while its ads barely bring in anyone new.
Acquisition MER (also called new customer MER or aMER) fixes that:
Acquisition MER = revenue from new customers ÷ total ad spend
If your overall MER holds steady while acquisition MER drops, your returning customers are carrying the number and your ads are getting less efficient at finding new buyers. That's an early warning, well before it shows up in the bank. Track both side by side, together with your CAC and the new vs returning split.
How to Track MER for Your Shopify Store
You can calculate MER in a spreadsheet:
- Export net sales from Shopify for the period.
- Export spend from every ad platform for the same period: Meta, Google, TikTok, Pinterest and any others you run.
- Divide revenue by total spend.
- Repeat with revenue from first-time customers only to get your acquisition MER.
That works, but it's a weekly chore, and it's easy to forget a channel or mix up date ranges. TrackBee does it for you. The TrackBee Insights attribution report shows your blended overview with acquisition MER over time, next to each platform's own numbers, so you see how much every platform over- or under-reports. And TrackBee Mobile puts today's revenue and MER on your phone.
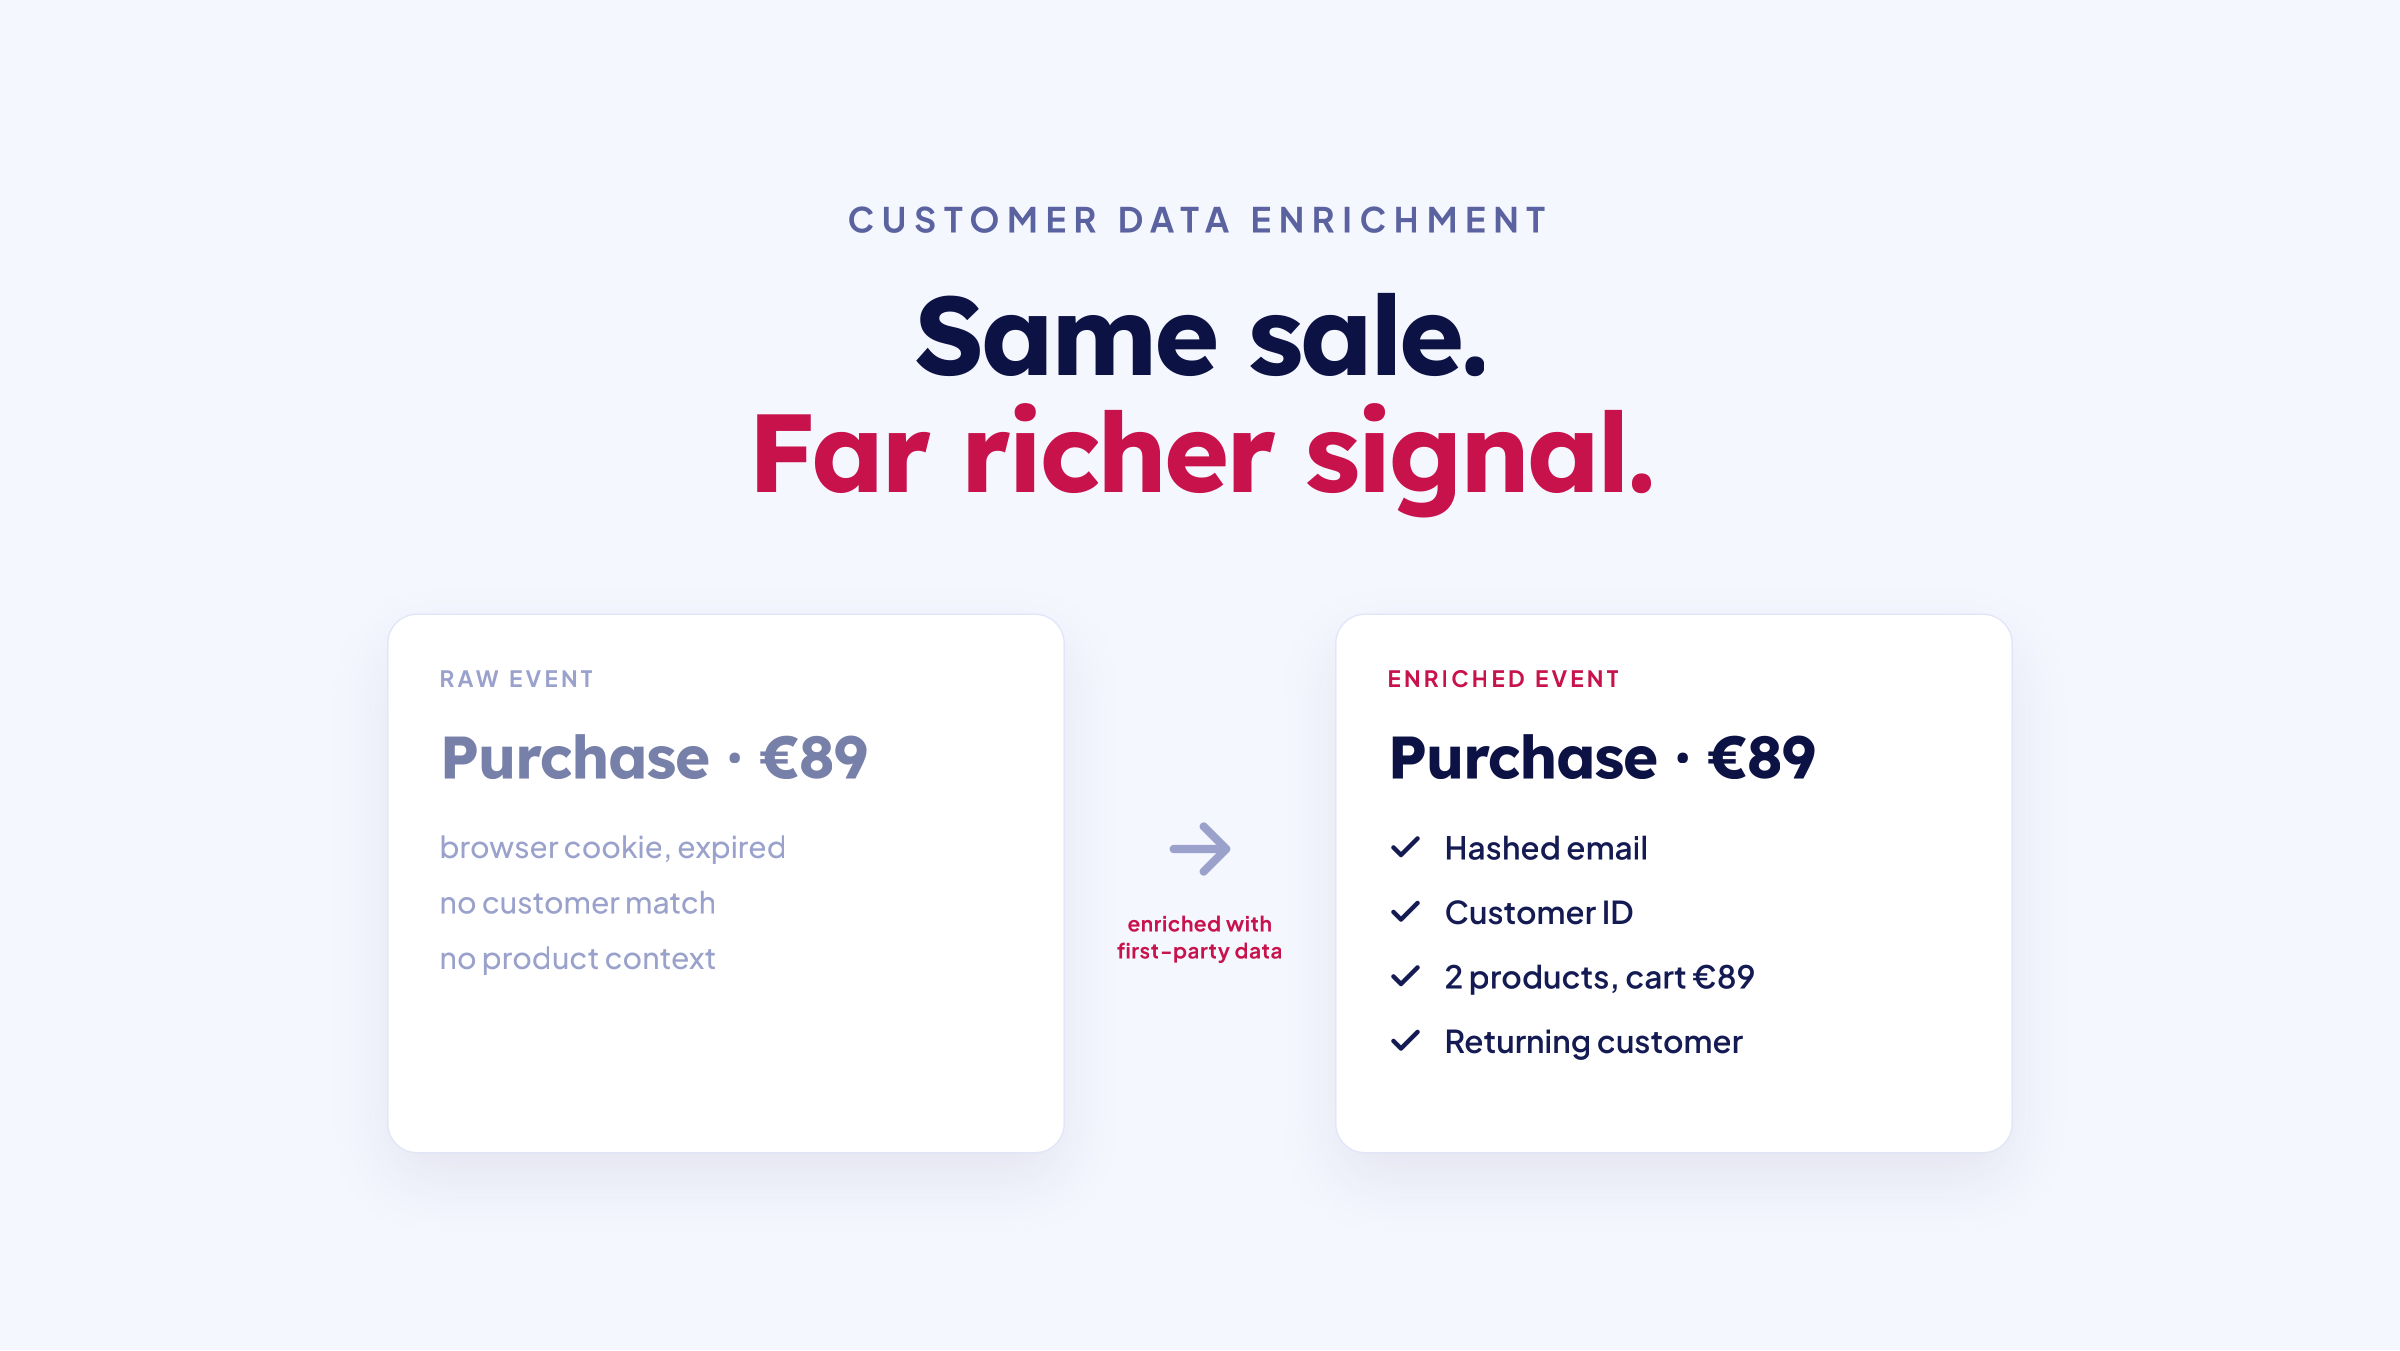
MER tells you if your marketing works. To find out where, you still need platform data you can trust. TrackBee sends every Shopify purchase to your ad platforms server-side and enriches it with first-party data, so each platform gets the conversions a browser pixel would have missed, deduplicated. Better data in each platform means better bidding, and in the end a better MER. Read more in our guide to ecommerce metrics to track.
MER During Black Friday and BFCM
MER is especially useful around Black Friday and Cyber Monday. CPMs rise, discounts squeeze your margin, and every platform reports record ROAS at the same time.
Two things to keep in mind:
- Recalculate your break-even. A discount comes straight out of your margin. Take a product that sells for €100 and leaves €40 after variable costs. At 25% off it sells for €75 and leaves €15, so your margin drops from 40% to 20% and your break-even MER doubles from 2.5 to 5.0.
- Watch acquisition MER after the peak. BFCM brings in a lot of new customers. Whether that spend paid off shows up in the weeks after, when you see how many of them come back.
Limits of MER
MER tells you how the store is doing overall. It won't tell you what to change. Keep these limits in mind:
- It doesn't tell you which campaign, ad set or creative to change. Use platform ROAS and POAS for that.
- It includes organic and returning revenue, so a strong brand or email program can hide weak ads. Acquisition MER helps here.
- It's sensitive to timing. Spend today can drive sales next month, so look at trends over weeks, not single days.
- It says nothing about margin. A MER of 4 on a 20% margin product loses money. Always compare it with your break-even.
Frequently Asked Questions
What is MER in marketing?
MER (marketing efficiency ratio) is your total revenue divided by your total ad spend across all channels. It shows how much revenue your store makes for every euro or dollar spent on ads, without relying on any platform's attribution.
What is the marketing efficiency ratio formula?
MER = total revenue ÷ total ad spend. With €100,000 revenue and €25,000 ad spend, your MER is 4.0.
What is a good marketing efficiency ratio?
It depends on your margins. Your break-even MER is 1 divided by your contribution margin before ads. With a 40% margin, break-even is 2.5. A good MER sits comfortably above your own break-even, by enough to cover fixed costs and profit.
Is MER the same as ROAS?
No. ROAS uses the revenue a single platform attributes to itself. MER uses all store revenue against all ad spend. Because platforms often claim the same sale, the sum of platform ROAS often comes out higher than your MER.
What is the difference between MER and blended ROAS?
There is none. Blended ROAS is another name for MER.
What is acquisition MER?
Acquisition MER is revenue from new customers divided by total ad spend. It shows how efficiently your ads bring in new buyers, without returning customers flattering the number.
How often should I check MER?
Look at it daily for big swings, but judge it on weekly and monthly trends. Daily MER is noisy because of weekends, paydays and delayed purchases.
Track MER Without the Spreadsheet
MER is the quickest way to check whether your ads pay for themselves. Add acquisition MER and platform data you can trust, and you also see where the money works. Try TrackBee free for 30 days, or book a free demo and we'll show you your own MER.