


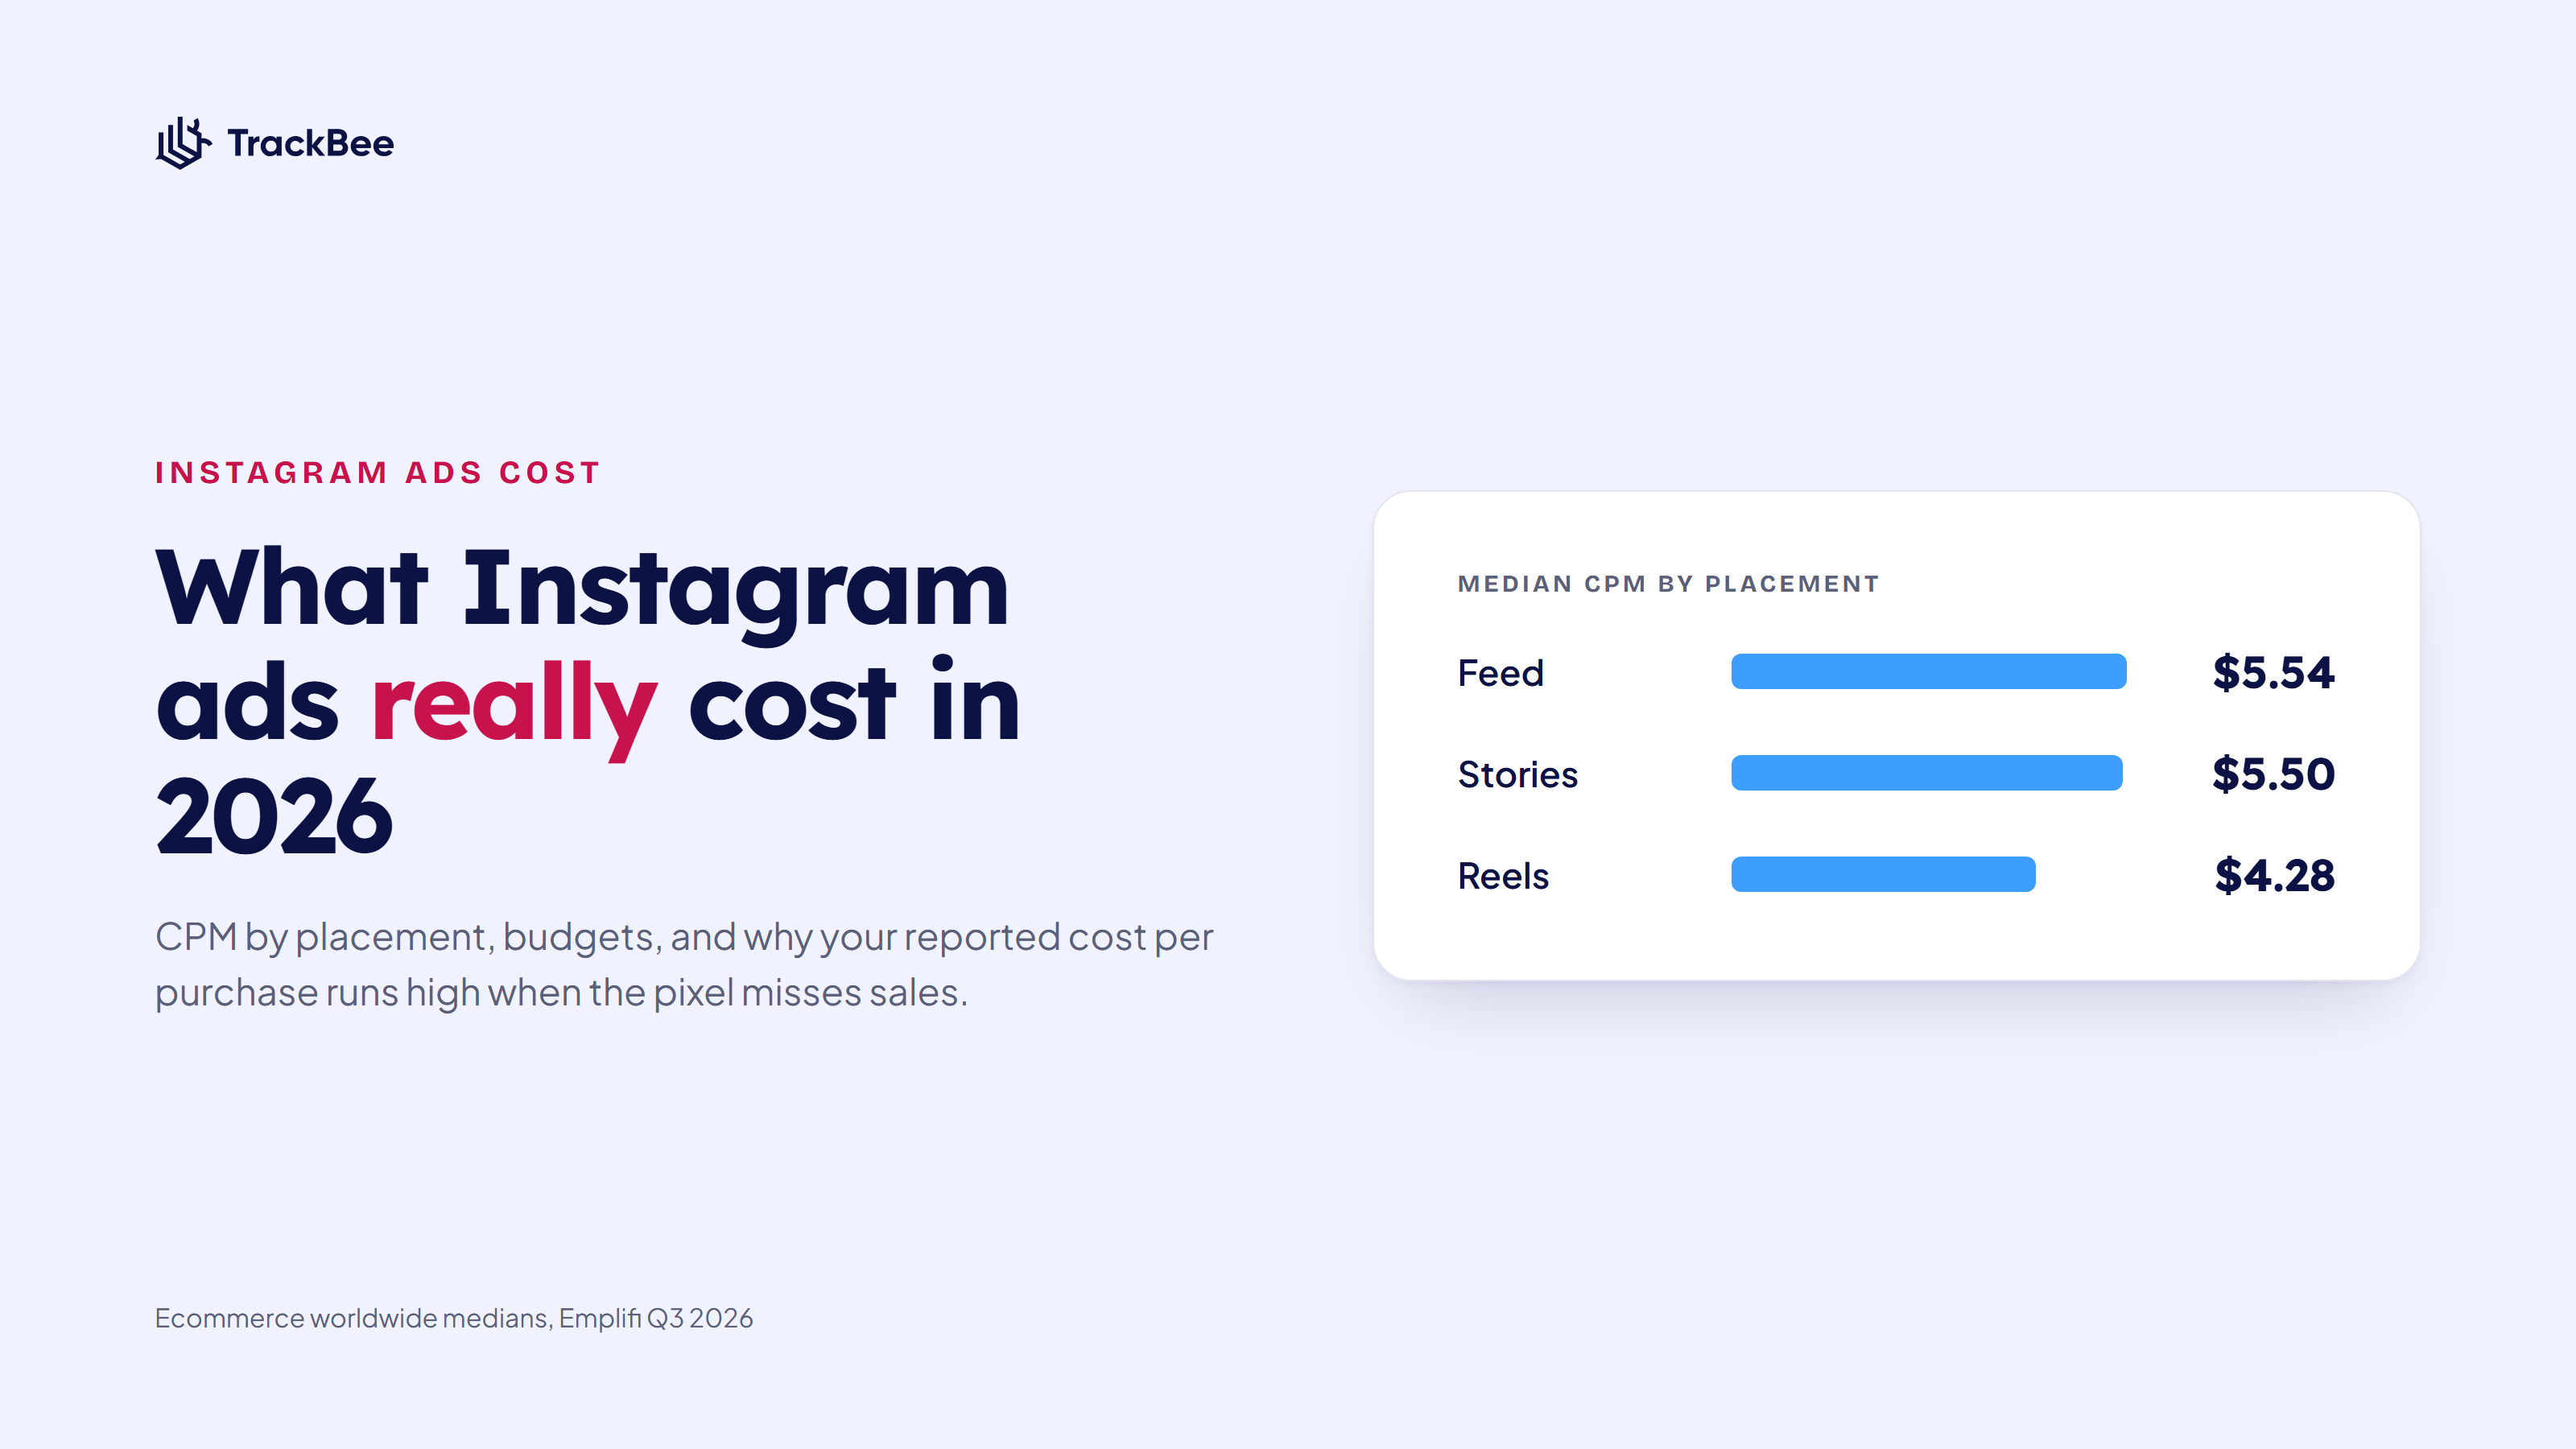


How much does an Instagram ad cost? Less than most people expect per impression, and more than you think per sale if your tracking is incomplete. Instagram ad cost depends heavily on where your ad shows up: Feed, Stories, Reels or Explore each price differently. This guide gives you the 2026 numbers by placement, a realistic budget for a Shopify store, and the reason your Instagram cost per purchase in Ads Manager is probably wrong.
The short answer: in 2026, Instagram ads typically cost $4–$8 per 1,000 impressions (CPM) and $0.50–$1.20 per link click, based on Emplifi, Gupta Media and WordStream benchmarks. Reels is usually the cheapest placement per impression, Stories the cheapest per click, and Feed the most expensive on both. Ecommerce sales campaigns aimed at US or Western European buyers pay more, often $10–$15 CPM. Plan $20–$50 a day to test.
Instagram Ad Cost at a Glance
| Metric | 2026 range | Source |
|---|---|---|
| CPM, ecommerce ad accounts (worldwide median) | $4.28–$5.54 depending on placement | Emplifi, Q3 2026 |
| CPM, blended Instagram | $8.16 | Gupta Media Social CPM Tracker, June 2025 |
| CPC, ecommerce ad accounts (worldwide median) | $0.54–$0.81 depending on placement | Emplifi, Q3 2026 |
| Cost per link click | $0.50–$1.20 | WordStream, updated May 2026 |
| Cost per link click, blended | $0.69 | Gupta Media, June 2025 |
| Cost per engagement | $0.03–$0.08 | WordStream, updated May 2026 |
| CPM, Meta sales campaigns for DTC brands (Facebook and Instagram combined) | $15.06 median | Ecommerce benchmark of 40,000+ Meta advertisers, Aug 2025–Jul 2026 |
The lower numbers are medians across many objectives and countries, including cheap awareness campaigns. The $15 figure comes from ecommerce brands running mostly sales campaigns, which is closer to what a Shopify store pays when it optimizes for purchases. There is no official Instagram price list: Instagram ads run through Meta Ads Manager in the same auction as Facebook.
Instagram Ads Cost by Placement: Feed, Stories, Reels and Explore
Placement-level data is thinner than most cost guides suggest. Only a few sources publish it, they measure slightly different things, and none of them publish a reliable figure for Explore. These are the two datasets we could verify.
Emplifi, ecommerce ad accounts, Q3 2026 (worldwide medians)
| Placement | CPM | CPC | CTR | Share of ecommerce spend |
|---|---|---|---|---|
| Instagram Feed | $5.54 | $0.81 | 0.70% | 15.2% |
| Instagram Stories | $5.50 | $0.54 | 0.89% | 11.9% |
| Instagram Reels | $4.28 | $0.80 | 0.57% | 9.3% |
| Facebook Feed (for comparison) | $4.17 | $0.26 | 1.58% | 35.5% |
Source: Emplifi Q3 2026 ecommerce benchmarks. Medians across ecommerce ad accounts from all regions, with a minimum of 200 active ad accounts per benchmark.
Gupta Media, January 2025 (cost per link click)
| Placement | CPM | Cost per link click | Link CTR |
|---|---|---|---|
| Instagram Stories | $7.25 | $0.94 | 0.77% |
| Instagram Reels | $4.29 | $1.21 | 0.35% |
Source: Gupta Media, Instagram ads cost. Gupta does not publish a Feed or Explore split.
Instagram Feed Ads
Feed is the most expensive Instagram placement in Emplifi's data, per impression and per click, because the main scroll is where competition is highest. It suits product images, carousels and catalog ads, and it is the second-biggest line in an average ecommerce budget.
Instagram Stories Ads
Stories has a CPM close to Feed but the lowest cost per click of the Instagram placements in both datasets ($0.54 in Emplifi, $0.94 in Gupta Media). For traffic to a product page, a full-screen 9:16 Story with a clear call to action is often your cheapest Instagram click.
Instagram Reels Ads
Reels is the cheapest way to buy Instagram impressions ($4.28 CPM in Emplifi, $4.29 in Gupta Media). Clicks are another story. Reels has the lowest click-through rate, so you pay more per click than in Stories. Reels is strongest for reach and product discovery, as long as the creative looks like a native Reel and not a repurposed TV spot.
Instagram Explore Ads
Explore ads show up while people browse the Explore grid. We could not find a reliable, recent published benchmark for Explore on its own, so any exact figure you see online is a guess. With Advantage+ placements it usually gets a small share of spend. Check its numbers in your own placement breakdown.
Check Your Own Placement Costs
Benchmarks are a starting point. In Ads Manager, open your campaign and choose Breakdown → By delivery → Placement. You will see CPM, CPC and cost per result for each Instagram and Facebook placement, based on your own audience and creative. That is the number to budget on.
Why Instagram Ad Cost Benchmarks Disagree So Much
You will find Instagram CPMs quoted anywhere from $2 to $15. Four things explain most of that spread:
-
Objective: awareness and engagement campaigns buy cheap impressions. Sales campaigns compete for the people most likely to buy, and those impressions cost more.
-
Geography: worldwide medians include low-cost markets. US, UK and Western European audiences cost more.
-
Click definition: "all clicks" include likes, profile taps and expanding a caption. "Link clicks" only count visits to your site. WordStream puts all-click CPC at $0.40–$0.70 and link CPC at $0.50–$1.20.
-
Sample and date: some widely shared numbers come from 2022 or 2023. Meta's average price per ad rose 14% year over year in Q3 2026, according to its earnings release, so older benchmarks understate today's prices.
When you compare your account to a benchmark, compare the same objective, market and click type.
How Much Should You Budget for Instagram Ads?
There is no minimum spend specific to Instagram. You set a daily or lifetime budget in Ads Manager, and Meta's floor is about $1 a day for impression-based ad sets, a little higher for click- or conversion-optimized ones. A budget that low will not teach you much, though.
Budget guidelines for a Shopify store
| Stage | Daily budget | What you get |
|---|---|---|
| Boosting a post or awareness test | $5–$20 | Reach and engagement data, little sales signal |
| Sales test, one ad set | $20–$50 | Enough data in 7–14 days to compare creatives |
| Exiting the learning phase on purchases | (target CPA × 50) ÷ 7 | About 50 purchases per week per ad set |
The last row matters most. Meta's learning phase needs about 50 optimization events per ad set within seven days. At a $30 target CPA that means roughly $215 a day per ad set to exit learning within a week. Smaller budgets still work, they just stay in learning longer.
Most brands do not run Instagram-only campaigns. They use Advantage+ placements and let Meta split spend between Facebook and Instagram. For the full Meta budget picture, see our guide on how much Facebook ads cost.
What Drives Instagram Ads Cost
Campaign objective. Purchase-optimized campaigns cost more per impression than reach campaigns, because Meta shows them to people it predicts will buy.
Audience size and type. Broad audiences are cheaper than narrow interest stacks. Retargeting audiences are small and contested, so they cost more per impression, but they usually convert better.
Season. Costs climb in Q4. In Gupta Media's 2023 data, Instagram CPM rose from $6.21 in January to $8.80 in November. January is usually the cheapest month of the year.
Creative fit. Ads that match the placement get better engagement, and Meta rewards that with lower prices. That means 9:16 vertical video for Stories and Reels, and 1:1 or 4:5 for Feed. A landscape video squeezed into Reels costs more and converts less. Our UGC framework for Meta and TikTok helps here.
Industry. In a 2026 benchmark of 40,000+ ecommerce Meta advertisers, health and wellness has the highest median CPM ($21.80) and electronics the highest cost per purchase ($51.86), while baby products have the lowest CPM ($11.50).
Signal quality. Meta optimizes on the conversions it receives. If a large share of your sales never reaches Meta, the algorithm targets less accurately and your effective cost rises. Unlike season or industry, this is something you can fix.
Instagram vs. Facebook Ad Costs
Per click, Facebook is usually cheaper. In Emplifi's Q3 2026 ecommerce data, Facebook Feed had a $0.26 median CPC against $0.54–$0.81 for Instagram placements, and a much higher click-through rate. Per impression, the two are close: Facebook Reels ($4.13) and Instagram Reels ($4.28) are nearly the same.
That does not make Instagram the worse buy, since a pricier click can still lead to a cheaper sale. Let the auction decide with Advantage+ placements, then check the placement breakdown for cost per purchase, not just CPC. For Facebook-specific CPM, CPC and CPA benchmarks, read our Facebook ads cost guide, and for every channel side by side, our 2026 ad cost benchmarks.
Why Your Reported Instagram Cost Per Purchase Is Off
Most Instagram cost guides stop at CPM and CPC. The CPM and CPC in Ads Manager are exact, because Meta knows what it charged you. The cost per purchase is not, because it depends on how many purchases Meta can see.
Instagram traffic is especially hard to track in the browser:
-
Instagram is used almost entirely on phones. On iPhones, App Tracking Transparency lets users opt out of app tracking, which limits what Meta can connect.
-
Links open in Instagram's in-app browser. A shopper who taps your ad, browses, and comes back later in Safari or Chrome to buy looks like a new visitor. That is a cross-device and cross-browser gap the pixel cannot close.
-
Safari's tracking prevention and ad blockers shorten cookie lifetimes or block the pixel outright. See ITP and ad blockers.
-
Consent banners stop the pixel until a visitor accepts.
Together, these gaps mean browser pixels miss around 30-60% of conversions. Say you spend $2,000 on Instagram and Meta reports 50 purchases: a $40 cost per purchase. If the pixel missed 40% of real orders, there were about 83 purchases and your true cost was closer to $24. You might pause the placement that was actually your best one.
The fix is to send purchases to Meta from a server as well as the browser, through the Meta Conversions API. Server events do not depend on the in-app browser, cookies or blockers, and event deduplication makes sure a purchase seen by both pixel and server counts once. Meta explains the mechanism in its Conversions API documentation.
TrackBee does this for Shopify stores. It sends every purchase to Meta server-side and enriches it with first-party data, so Meta can match more orders to the people who saw your Instagram ads. That gives you a truer cost per purchase per placement, and it gives Meta's algorithm more signal to find buyers. Read our Meta Conversions API guide for Shopify, see why Meta conversions don't match Shopify, or check the Meta integration.
How to Lower Your Instagram Ad Costs
-
Use Advantage+ placements so Meta can shift budget to the cheapest placement for each result, then review the breakdown monthly.
-
Refresh creative before it fatigues. Rising frequency and falling CTR usually show up before CPA climbs.
-
Plan around Q4. Test new creative in September and October, and expect higher CPMs in November.
-
Fix your conversion data first. Before you cut a placement for a high CPA, make sure Meta is receiving all your purchases. Our post on how much revenue you lose to bad tracking shows how to estimate the gap.
Frequently Asked Questions
How much does an Instagram ad cost per day? You choose. Meta's minimum is about $1 a day for impression-based ad sets, but a useful sales test usually needs $20–$50 a day per ad set. To exit the learning phase on purchases, budget roughly (target CPA × 50) ÷ 7 per ad set.
How much do Instagram ads cost for 1,000 views? That is the CPM. In 2026 benchmarks it ranges from about $4.28 (Reels) to $5.54 (Feed) for worldwide ecommerce accounts in Emplifi's Q3 2026 data, with a blended $8.16 in Gupta Media's tracker. Sales campaigns in the US and Western Europe often pay $10–$15 or more.
Which Instagram placement is cheapest? Reels is usually cheapest per impression and Stories cheapest per click. Feed is the most expensive on both in Emplifi's Q3 2026 data. Explore has no reliable public benchmark, so check it in your own placement breakdown.
Are Instagram ads more expensive than Facebook ads? Per click, yes, in most data. Emplifi's Q3 2026 ecommerce medians show $0.26 per click on Facebook Feed versus $0.54–$0.81 on Instagram placements. Per impression the gap is small. Compare cost per purchase, not just CPC.
Is $5 a day enough for Instagram ads? It is enough to boost a post or test reach. It is not enough to learn which ads drive sales, because Meta needs about 50 purchases per ad set per week to optimize properly. For sales, start at $20–$50 a day and consolidate into fewer ad sets.
Why is my Instagram cost per purchase so high? Check three things: whether your audience is too narrow, whether your creative fits the placement, and whether Meta is seeing all your sales. With the in-app browser, iOS opt-outs and blockers, browser pixels miss around 30-60% of conversions, which makes the reported cost per purchase look worse than it is.
Know What Your Instagram Ads Really Cost
Instagram ads are reasonably priced per impression in 2026, especially in Reels, and Stories often delivers the cheapest clicks. The number that decides whether Instagram is worth it is cost per purchase, and that number is only as good as the conversion data behind it. When Meta receives every order server-side, enriched with first-party data, you can judge each placement on the sales it actually drives.


